Setting profiler and flame-graph in Visual Studio Code
As you are reading this, I imagine your program works as it is supposed to but you are working on next step called “Optimization”. You have already looked for memory leaks, used appropriate algorithms, organized your if-else’s but still it is getting trickier to identify what part of code is eating most of the CPU units.
With the Node.js 4.4.0, one can use inbuilt profiler by node — prof app.js but this starts profiling the whole node process. If we want to profile a piece of code or run profiling for an interval, Visual Studio plugin comes in handy.
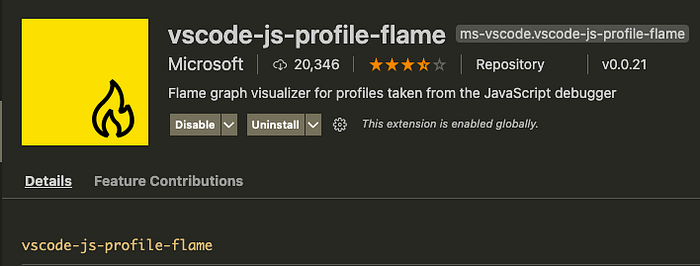
This can be done really easily. Simply install vscode-js-profile-flame plugin.

We are now ready to start profiling.
- Write a simple program “app.js”
setInterval(function(){
    console.log("after every section");
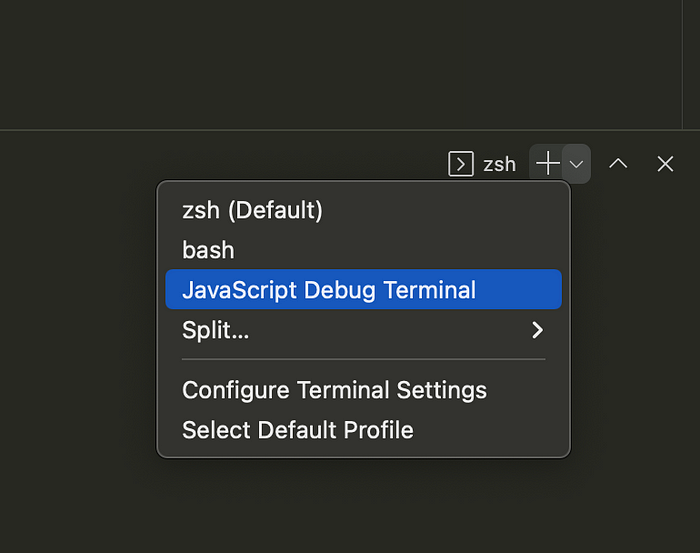
}, 1000);- Start Javascript debug terminal

- run the program — node app.js
- Add breakpoints at line 2 & 3
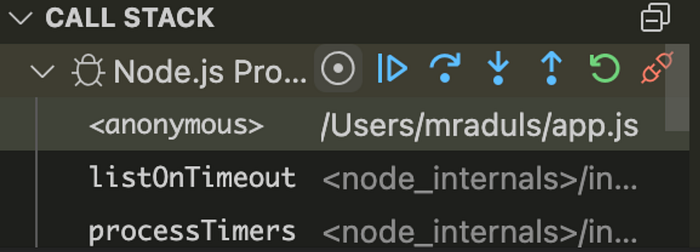
- Click on Performance profile button

- Select the breakpoints
- Continue in the debugger
vscode-profile-{timestamp}.cpuprofile is generated
This profile data can be converted to a flame graph just by clicking the button on the right


